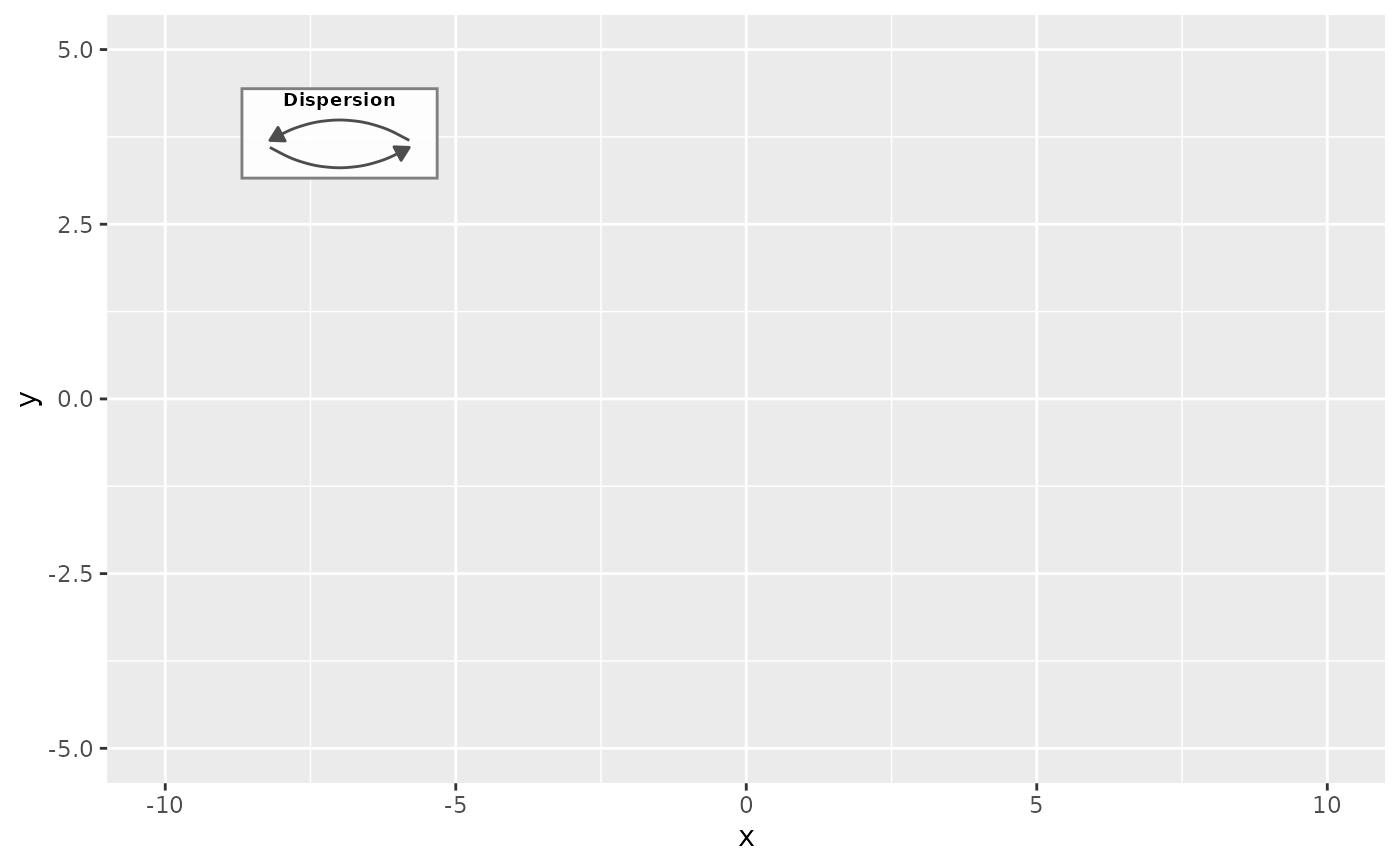
Builds a mini-legend showing the dispersion convention for curved branches. The legend displays two curved arrows demonstrating left-to-right and right-to-left dispersions.

add_dispersion_legend(bbox, curvature = -0.3, text_size = 2.5)

Arguments

bbox

list with xlim and ylim from get_data_bbox()

curvature

curvature value used in the main plot

text_size

text size for the legend labels (default: 2.5)

Value

A list of ggplot2 annotation layers that can be added to a ggplot object

Examples

bbox <- list(xlim = c(-10, 10), ylim = c(-5, 5))
p <- ggplot2::ggplot() + ggplot2::xlim(bbox$xlim) + ggplot2::ylim(bbox$ylim)
p + add_dispersion_legend(bbox)